Title: Statistical analysis paper on Generic trends in power sector of India
Authors: Prasenjit Deb & Vaibhav Pawar, 3rd Year BTech, Electrical Engineering Department
College: Rajiv Gandhi College of Engineering & Research, Nagpur
Abstract
The power sector of the country in the modern era has grown tremendously since the formation of present day India. After the post colonial era the power generating capacity of the central Asian country has shown staggering growth from 1,800mw to 229.34gw and the according to the 12th five year plan it is to be doubled by the year 2025 by current trend India is the 9th biggest economy in the world and the 5th largest producer of electrical power in the world for the fiscal year 12-13
Introduction
Even after generating bulks of power there is still a large gap between the demand and availability of power in the region .This paper mainly intends on understanding the current scenario and put emphasis on finding solution at grass root level.
Power structure
India is geographically the 7th largest nation in the world in the second half of 20th century it has vast diversity in its whether climate and land form and an area comprising of 387590 kilometers the power distribution of such a vast nation is very difficult and maintained at local regional and national level the country owns 274,882 circuit kilometers of transmission line and the complete power structure itself is maintained by the central and the state governments at respective levels this mammoth infrastructure is mainly divided under 5 major grids at the national level they are northern eastern western southern and north-eastern Even after attaining enormously in the field of electricity generation there is still a large amount of deficit in the nation
Energy gap between supply and demand during recent years:
| Serial number | region | Requirement | % deficit | M kilowatt-hour |
| 1 | North | 224,218 | -10.8 | 330,34 |
| 2 | West | 254,486 | -16.0 | 372,40 |
| 3 | South | 204,086 | -7.5 | 28,340 |
| 4 | East | 82,127 | -4.6 | 12,901 |
| 5 | North-east | 9,407 | -17.5 | 1,820 |
| Total | 774,324 | -11 | 109,809 | |
As per 2009 statistics
As we can see there is a major difference in the production capacity and requirement as the consumers of the southern Asian country the north eastern grid seems to have most deficit in terms of percentage but the requirement for bulks of power grows in the westerns and northern states the major reason for this growth in demand is because the northern and west parts contain more population as wells as the irrigation load in this areas remain high for most part of the year. A power system comprises of the major functioning this include generation transmission and distribution we now take a look into the existing scenario of the country.
Generation
The power generation in India takes place at 11kv-22kv range depending upon the type of production employed .The major sources of production in India are thermal hydroelectric nuclear and non conventional out of these the thermal plants own a lion share of almost 50% followed by hydro and nuclear the non conventional energy sources still remains low in present scenario.
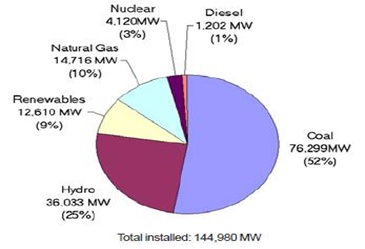
Even though the coal fired plants produce abundance of energy the ratio of production share is to change by 2025 the coal fired plants are to go down because various reasons related to the thermal power plant
Transmission
Generating stations are created away from the load center due to some site selection criteria. Due to this reasons the generated electrical energy has to be transmitted to the consumer via some conducting materials. If these conductors are located over head with suitable spacing between them and adequate clearance from ground then it is called as overhead transmission line. If these conductors are placed underground by properly insulated from each other then the system is known as underground transmission system.
Standard transmission voltages in India are Upto 1970’s the electrical power was transmitted in the AC high voltage upto 220kv. The present trend has been high voltages (upto 300kv) to extra high voltage (300kv to 765kv) & ultra high voltages (above 765kv)
Transmission voltages used in India are 33kv, 66kv, 110kv, 132kv, 220kv, and 440kv. The next higher voltage of 765/800kv has been adopted for transmission a huge blocks of power generating station to load center
- 400kv
- 220kv
- 132kv
- 110kv
- 66kv
- 33kv
- 22kv
- 11kv
Normal voltage of primary transmission refer to Indian scenario are
- 132kv
- 220kv
- 400kv
Distribution:
Electrical energy is generated far away from the consumers. Hence it is transmitted over a long distance and finally distributed to the various consumers. Distribution system is an electrical network through which electrical energy actually distributed to consumer for utilization.
Standard distribution voltages in India are:
- 11kv
- 415v
- 230v
Transmission and Distribution Losses
In India, average T & D (Transmission & Distribution) losses; have been officially indicated as 23 percent of the electricity generated. However, as per sample studies carried out by independent agencies including TERI, these losses have been estimated to be as high as 50 percent in some states. In a recent study carried out by SBI Capital Markets for DVB, the T&D losses have been estimated as 58%. This is contrary to claims by DVB that their transmission and distribution losses are between 40 and 50 percent. With the setting up of State Regulatory Commissions in the country, accurate estimation of T&D Losses has gained importance as the level of losses directly affects the sales and power purchase requirements and hence has a bearing on the determination of electricity tariff of a utility by the commission.
Transmission and distribution losses:
| Serial | year | T&Dlosses | maximum |
| 1 | 2004-05 | 31.25 | 39.33 |
| 2 | 2005-06 | 30.42 | 33 |
| 3 | 2006-07 | 28.65 | 30.62 |
| 4 | 2007-08 | 27.20 | 29.45 |
| 5 | 2008-09 | 25.47 | 27.37 |
| 6 | 2009-10 | 25.39 | 26.58 |
| 7 | 2010-11 | 23.97 | 26.15 |
The per capita energy consumption of the region is very marginal compared to the western contemporary economies. Although the good think about this is that it has shown positive slope and is growing nearly every year at good rate but the lack of infrastructure and resources the power sector corporations are finding it difficult to meet the requirement of the time
Annual per capita energy consumption of india
| Serial | Year | Gross(kwh) |
| 1 | 2005-06 | 631.4 |
| 2 | 2006-07 | 671.9 |
| 3 | 2007-08 | 717.1 |
| 4 | 2008-09 | 733.5 |
| 5 | 2009-10 | 778.6 |
| 6 | 2010-11 | 818.8 |
| 7 | 2011-12 | 879.22 |
Feasible remedies to current difficulties
- The T&D losses shall be minimized at all levels by moving to UHVAC &HVDC range
- The commissioning of newer smart grid technology should be implemented at earliest possible at the state and central level and the decommissioning of older and less efficient grids and plants as in possible
- Shifting to a higher phase order system at transmission level to boast transmission efficiency
- Development and deployment of Non-conventional energy resources to replace the lower efficient thermal power plant so as to reduce the carbon emission
- Promotion of energy conservation at grassroots level and make strict and straight laws for energy management and ensure proper usage of electrical energy at industrial and commercial levels
- To connect the captive power plants to local grids so as to ensure better energy management
Conclusion
There has been tremendous boom in the sector and it has shown rapid growth in production as well as expansion reaching to remote regions of the country but the 21st century will put forth herculean challenges in front of the technocrats of the power sector and to meet the test of time the way for new technological advancements must be paved and wise planning and investments to be made in time.
References
- Energy markets and technology by R V Shahi secretary Government of India (ministry of power)
- National energy map of India vision 2030 published by TERI isbn 81-7993-064-5
- Electrical India December issue 2013
- Central statistics office new Delhi
- Indian power engineering journal -2013