Title: Energy Efficient Design of Climate Change Monitoring System Based on Ubiquitous WSNS Using Solar Cell
Authors: S.Srivani & J.Deenamani
Organisation: Malla Reddy Engineering College for Women
Abstract—In the context of ubiquitous wireless sensor network, this paper presents a framework for wireless sensor networks (WSNs) designed to observe impacts of climate change in crop fields. We propose a system architecture for ubiquitous WSNs for monitoring automatically and continuously in real-time. A prototype system includes two base stations and several sensor nodes which are powered by solar cell are designed and implemented. In this paper, the energy efficient design of climate change monitoring system based on ubiquitous WSNs using solar cell is proposed. Working climate sensor station has successfully gathered climatic parameters from environment sensor such as wind speed, wind direction, temperature, humidity, water level, conductivity, and pH. In the proposed design of sensor and base stations, the energy efficient wireless sensor network and low power consumption hardware of stations ensure the automatic and long term operation with the solar power supply. Power consumption estimation and NS-2 simulation results prove the energy efficient of environment stations and data collection networks.
INTRODUCTION
The impacts of climate change lead to global average temperature rise, salinity intrusion, flood increasing, lack of water can affect negatively to crop yields. In order to research all effects of climate change on human activities, and to find a solution for human to adapt with climate change, an automatic and continuous monitoring of climatic parameters is an important requirement. In recent years, wireless sensor network (WSN) improve the agricultural decision making and apply coping strategies to combat the threats from climate change by using sensor nodes which one node can obtain many climatic parameters from a specific field in real time. For years, researches have proposed automatic environmental monitoring systems based on WSN [1], [2]. However, the network formed by WSN is only a local area network because it used one wireless transceiver that support just one communication interface and could not inter-connect with other networks. Hence, it could make difficult for monitoring areas where are very far from data center with require an inter-networking with different communication technologies.
Climate change monitoring application requires other types of networks to connect all monitoring areas to one data server center. For recent years, by combining General Packet Radio Service (GPRS) network with the WSN infrastructure [3], [4], [5], the problem of network management is solved so that climate change monitoring can be done anywhere at anytime. Consequently, the best solution to climate change monitoring would be achieved by integrating WSN with GPRS/3G network by using a gateway, which offers a more complete set of measurements as well as telecommunication for remote access. For practical deployment of an automatic monitoring network, life-time of sensor station is very important.
This life-time is almost decided by energy consumption of WSN communication nodes and GPRS modems whose radio transceivers are big energy consumer. Hence, keeping transceivers on all the time may lead to a problem of energy lacking. Therefore, for hardware design of climate monitoring station based on WSNs, many researches have proposed idea of using solar cell to serve for problem of energy consumption so that battery can be recharged automatically without changing a new one [6], [7]. This paper proposes a novel design of climate change monitoring system based on ubiquitous WSNs with solar power supply, and energy consumption evaluation is also investigated in order to prove the energy efficiency of monitoring station Compared to present methods, constructing this climate change monitoring system based on WSNs with the cost for each cluster of monitoring area is less than $5000 would bring us opportunity to apply in practice to monitor large-scale areas in developing countries. The proposed design is also aimed to an flexible network extension to monitor everywhere at any time with renewable energy for long-term operation.
OVERALL SYSTEM DESIGN
The overall architecture of WSN-based climate change monitoring system is illustrated in Fig.1. For network management, the WSN is divided into several sensing clusters according to monitoring areas. There are one base station and several sensor stations for each monitoring cluster, and a remote data monitoring center for a whole network. In climate monitoring application, the sensor stations which are deployed with distribution distance from 500m to 5km, will be responsible for the collection of specific climate parameters. Sensor stations play a role on sampling the environmental data and transfer that data to the base station via a cluster network star routing protocol. The base station is considered as a coordinating node and also acts as a gateway node (for inter-networking with GPRS/3G cellular data network). It receives the data from sensor stations, take data processing, and transmit data packets to the remote monitoring center by GPRS/3G data network. The automatic and remote monitoring takes responsibility of analyzing data, storing, displaying, and sending data back to a control base stations.
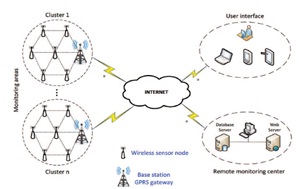
Fig. 1. A schematic view of system architecture
For practical deployment, there will be some situations that monitoring areas are not in GPRS/3G coverage or GPRS/3G signal is very weak. Hence, we propose a solution that uses more sensor nodes placed in between base station and sensing stations. They will play a role as routers to forward data packets from sensor station to base station that placed in region having GPRS service.
HARDWARE DESIGN OF THE SYSTEM
A. Energy efficiency data collection network
With the last goal is design a efficiency network which contents low power station hardware and sensor nodes. This part focuses on analyzing a good hardware for base station which satisfies some proposed conditions: low power, reliable transmission over rural environment… By comparing some newest wireless hardware in the world, a suitable hardware is chosen based on these proposed conditions. Table 1 shows that comparison.
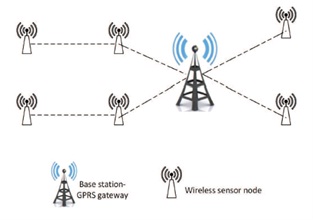
Fig. 2. Solution architecture for monitoring areas without GPRS
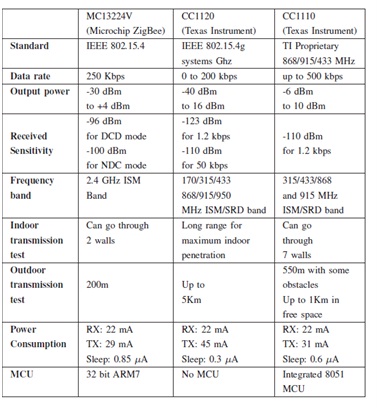
TABLE I HARDWARE COMPARISON OF WSN NODES
Depending on requirements of this research, a hardware is chosen which need to satisfy criteria such as good received sensitivity, high output power, low cost, low power consumption and transmission range should far enough. The CC1120 is a longest transmission range hardware which compares with CC1110 and ZigBee MC13224V. Practical test of CC1120 is up to 5Km ( which is 10Km in datasheet [8]) in rural environment, this is the most practical for long range weather monitoring application. Especially, the most important reason WSN is chosen for this research because of it uses battery, which can use by solar battery and normal AA battery for reserve plan. In this work, we use wireless module for CC1120 development kit in Fig.3. Moreover, Texas Instrument (TI) also supports a protocol named SimpliciTI for their hardware, that is a very good protocol which is designed for TI low power radio frequency network. This protocol supports two simple network topologies: peer-to-peer and star topology. With star topology, it is very suitable for this research because of simple and it adapt with model of base station with supporting by 4 range extender.

Fig. 3. CC1120 tranceivers and development kits [8]
B. Sensor station :-
Environment sensors are integrated with wireless hardware which under the control of MSP430 MCU and transmission by CC1120 transceiver. This part is also consists power supply. Fig.4 represents for sensor node block diagram.
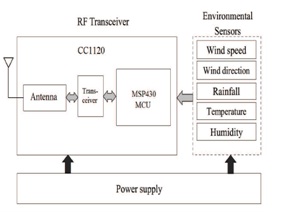
Fig. 4. Sensor node block diagram
C. Base station
Fig.5 shows the structure of hardware design for base station node. CC1120 operates in 433 MHz which communicates between sensor node and base station. There are two proposed solutions for communication between base station and user. Firstly, directly using FT232 module of development kit to connect with PC. Second, GPRS is used to transmit data from base station to remote center.
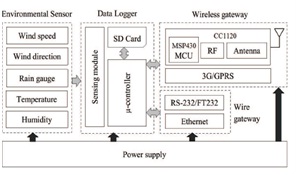
Fig. 5. Base station block diagram
Since the node platforms is design with solar cell, a large capacity battery and reliable DC-DC converting circuit have been well considered for the power supply module.
1) Power Supply Design: Power management is essential for long-term operation. To survive extreme weather conditions in long-term operation, we propose that battery will be fully charged for at least 7 days without recharging. Although our solar energy system is quite efficient, the radio transceiver is a big energy consumer: keeping it on all the time may lead to a negative energy balance (i.e., with regards to the incoming solar power). Consequently, duty cycling provides an effective way to achieve energy efficiency which is calculated by the ratio of Active time and Total time. In the current setup, the wireless modem wakes up for 30 seconds every 15 minutes for data collection which is equivalent to a duty cycle of about 3.3%. It is powered for during inactive periods. Table. II shows the current draw and duty cycle of all devices deployed inside the base station, which are powered by a 12V 2W solar panel and a 12V 4500mAh lead-acid rechargeable battery. To calculate the duty circle of sensor and CC1120 transceiver. Let assumes the sensor get data from environment every 5 minutes and take 10 seconds for each time. Beside, CC1120 transceiver transmits data every 15 minutes per time in two ways communication, transmit time is set 1 minutes. Duty circle of sensor take 3.3% and transceiver take 6.7%. Using the results from Table II, theoretical time for the next charging is given by 4500mAH.12V/ 207mW = 260 hours (or 10.8 days). In practice, a lead-acid battery cannot be 100% discharged repeatedly. Therefore, it is necessary to de-rate the battery by some amount, generally 25%. In this case, 25% of 260 hours is 65 hours. So the practical time between 2 recharging times is now given by 260 hours – 65 hours = 195 hours (or 8.1 days). Hence, the battery may support the system for more than 7 days without recharging, that adapt the design goal.
2) Environment sensors: A variety of Global Water environment sensors is used to monitor climatic parameters is shown in Fig.6

Fig. 6. Environment sensors for climate change monitoring. (a)Wind speed (b)Wind direction (c)Temperature (d)Humidity (e)Rain gauge (f)Conductivity and temperature (g)Water level (h)pH sensor.
As an observation from their specifications, we see that environmental sensors produce an output of 4-20 mA industrial standard. For data ADC (Analog to Digital Converter) process, this current signal (4-20 mA) must be converted to the voltage signal in order to be sampled by MCU. The Data logger will be undertaken this work and the output signal will be guaranteed on interval of 0 to 5V for sampling.
3) Data logger: Data logger is an electronic programmable instrument that records environmental data. In the design, our data logger can hold up data for several months by using a high capacity SD card module. Besides that, it is equipped with a 10-bit-resolution ADC and a wide variety of analog and digital input/output (I/O) ports to interface with numerous environment sensors such as air temperature, humidity, wind speed, wind direction, rainfall, water level, pH, conductivity etc.
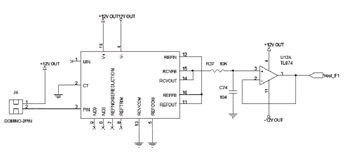
Fig. 7. A single sensing module in Data logger using RCV420 chip
To enable communication with other external devices, it is equipped a range of peripheral ports such as RS-232, USB and Ethernet on the gateway module.
4) Gateway: The gateway will provide a standard set of on-board peripherals to interface with external communication devices. With four serial ports on chip, Atmega1280 is well suited to serve as a gateway server. The gateway then has an RS-232 serial port to interface with GPRS modem, a COM port to interface with CC1120 RF transceiver, a FT232 module to interface with computer, and another COM port to interface with the Ethernet module.
SOFTWARE DESIGN OF THE SYSTEM
The self-organization and data transmission of the wireless sensor networks are based on SimpliciTI protocol stack. Sensor nodes will undertake task of sampling and sending data to sink node. Firstly, it initializes all components and warms up sensors. After that, it enters the existing network. After having received all the sensor data, it will process the received data and form a data packet, then enable the wireless communication module to transmit the data packet. After that, the sensor node turns into resting mode again. To save energy, duty cycle of 6.7% and 10% are applied for RF transceiver and GPRS modem respectively as mentioned in Table I.

Fig. 8. (a) Flow chart of the base station; (b) Flow chart of the sensor node
The base station is configured as network coordinator. It is responsible for building and maintaining the network, and undertaking the data transfer mission between the remote monitoring area and the data monitoring center. The main program flow charts of the base station and sensor node are shown in Fig.8.
EXPERIMENTS AND RESULTS
A.Meteorological monitoring station
A working meteorological monitoring station (sensor and base stations) is shown in Fig.9. In our experiment, two sensor stations and one base station are set up in crop field with transmission distance from 2km to 3km. This test system are able to monitor and record of four parameters which include wind speed, wind direction, temperature, humidity, and rain fall and then send this data to a computer of remote center in city down-town through GPRS and internet network.
B. Performance simulation and energy consumption estimation
Using network simulation 2 (NS-2) tool, the proposed network is simulated with previous data such as parameters, distances, star network topology… Besides, the possibility is evaluated from results of packet delivery ratio (PDR) energy consumption. Based on standard IEEE 802.15.4 (defined by The City College of New York and Samsung Advanced Institute of Technology, USA. [9]) and modified to adapt with SimpliciTI protocol which is supported by Texas Instrument. In simulation scenario, propagation Two Ray Ground model is used in physical layer. Besides, transmitted power is set to maximum 10 dBm and received sensitivity is set to -110 dBm at 1.2 kbps.
C. Packets delivery ratio evaluation
Fig.10 shows the PDR with changing number of end-nodes from 4 to 8 and distance from 500m to 1000m over one cluster. This figure represents for the number packets loss by collision after one days. However, standard IEEE 802.15.4 is used with mechanism to ensure that all dropped packet will be resent correctly 100%.
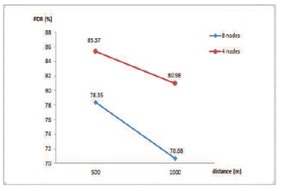
Fig. 10. PDR for 4 and 8 nodes with 500m to 1000m distance
From previous figure, the PDR is not so low because this number is ratio between total packets sent over total packets received (including resent packets) after 1 long day. It is easy to make sense when the time transmission longer, the number of loss packets by collision is larger. In WSN, packets delivery ratio is more than 50% that is enough for a stable network operating. This number shows that, with a very long range transmission, this network can work and work with either 4 or 8 end-nodes per cluster without influence to the PDR.
D. Total energy estimation
With the proposed scenario is that, let assumes there are 7 days that solar battery can not recharge. Hence, the extra battery supply for CC1120 modules must enough for keep network working 7 days. This scenario is simulated to observe energy of each node in network, including coordinator node and end nodes with transmission data every 15 minutes. Fig.11 .shows used energy of each node in network with 4 end-nodes after 1 day transmission.
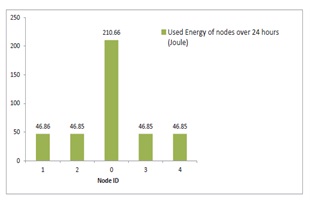
Fig. 11. Used energy of 4 end-nodes over 1 day
Energy of coordinator node is always higher than end-nodes, because it need to work all time and no idle mode, while these end-nodes after finish their transmission, they change to idle mode. Let assumes that dual-battery AAA with 1.5x2V and 900x2mAh have 9270J of total energy. Hence, the energy of coordinator nodes of these two network that is just approximately 220J. After 7 days, the used energy should be 1540J, it is enough with AAA dual-battery. In conclusion, by using NS-2 simulation the network has proven that it can work with a normal AAA dual-battery for 5 days transmission without solar recharging. Moreover, this battery is not only enough for coordinator nodes but also end-nodes in these 2 models of network.
CONCLUSION
In this paper, the energy efficient design of climate change monitoring system based on ubiquitous WSNs using solar cell is proposed. Working climate sensor station has successfully gathered climatic parameters from environment sensor such as wind speed, wind direction, temperature, humidity, water level, conductivity, and pH. In the proposed design of sensor and base stations, the energy efficient wireless sensor network and low power consumption hardware of stations ensure the automatic and long term operation with the solar power supply. Moreover, by applying the advanced WSN and GPRS/3G technology for data collection and transmission, numerous problems of real-time monitoring and coverage areas can be solved and by using solar power supply with high capacity Lead-acid battery, problem of energy consumption has been also overcome.
REFERENCES
[1] Z. Rasin and M. R. Abdullah, “Water quality monitoring system using zigbee based wireless sensor network,” International Journal of Engineering & Technology IJET, vol. 9, no. 10, pp. 24–27, 2009.
[2] J. Arun, J. Adinarayana, U. Desai et al., “Climate change scenarios with wireless sensor network & geo-ict: a preliminary observation,” in Proceedings of the Impact of Climatic Change in Agriculture, Joint International Workshop, 2009, pp. 194–199.
[3] A. Bagula, M. Zennaro, G. Inggs, S. Scott, and D. Gascon, “Ubiquitous sensor networking for development (usn4d): An application to pollution monitoring,” Sensors, vol. 12, no. 1, pp. 391–414, 2012.
[4] N. Jin, R. Ma, Y. Lv, X. Lou, and Q. Wei, “A novel design of water environment monitoring system based on wsn,” in Computer Design and Applications (ICCDA), in 2010 International Conference, vol. 2. IEEE, 2010, pp. V2–593.
[5] A. Al-Ali, I. Zualkernan, and F. Aloul, “A mobile gprs-sensors array for air pollution monitoring,” IEEE Sensors Journal, vol. 10, no. 10, pp. 1666–1671, 2010.
[6] A. Ghobakhlou, S. Zandi, and P. Sallis, “Development of environmental monitoring system with wireless sensor networks,” 2011.
[7] R. Nallusamy and K. Duraiswamy, “Solar powered wireless sensor networks for environmental applications with energy efficient routing concepts: A review,” Information technology journal, vol. 10, no. 1, pp. 1–10, 2011.
[8] T. instrument. Cc1120 development kit. [Online]. Available: http://www.ti.com/product/cc1120
[9] T. C. C. of New York and S. A. I. of Technology. Zigbee software modules. [Online]. Available: http://ees2cy.engr.ccny.cuny.edu/zheng/pub/
To download the above paper in PDF format Click on below Link: